Pico flash layout and XIP cache misses: report
This report covers the experiments behind the short article. The question: can a different arrangement of the code in flash make the Zephyr USB network stack fast on the Raspberry Pi Pico, without using the SRAM that an application needs? The background is in the previous post: one echo costs about 2,300 misses in the RP2040 XIP cache at about 70 clock cycles each.
Set-up and metrics
Board: Raspberry Pi Pico (RP2040, 125 MHz), connected over USB full speed, CDC-ECM class, Zephyr main of 31 October 2026, a small echo application, -Os. All images use the same source code; only the build or link options change. The XIP cache has 16 KB, two ways and 8-byte lines, so it has 1024 sets and a line at address a goes to set (a >> 3) mod 1024 (RP2040 datasheet §2.6.3.1).
| Metric | How it is measured |
|---|---|
| Misses per echo | XIP_CTRL hit and access counters read over SWD; 300 pings at 20 ms intervals, minus an idle window of equal length. |
| Turnaround | usbmon on the host: time from the end of the OUT transfer to the end of the IN reply, median of 300 pings. |
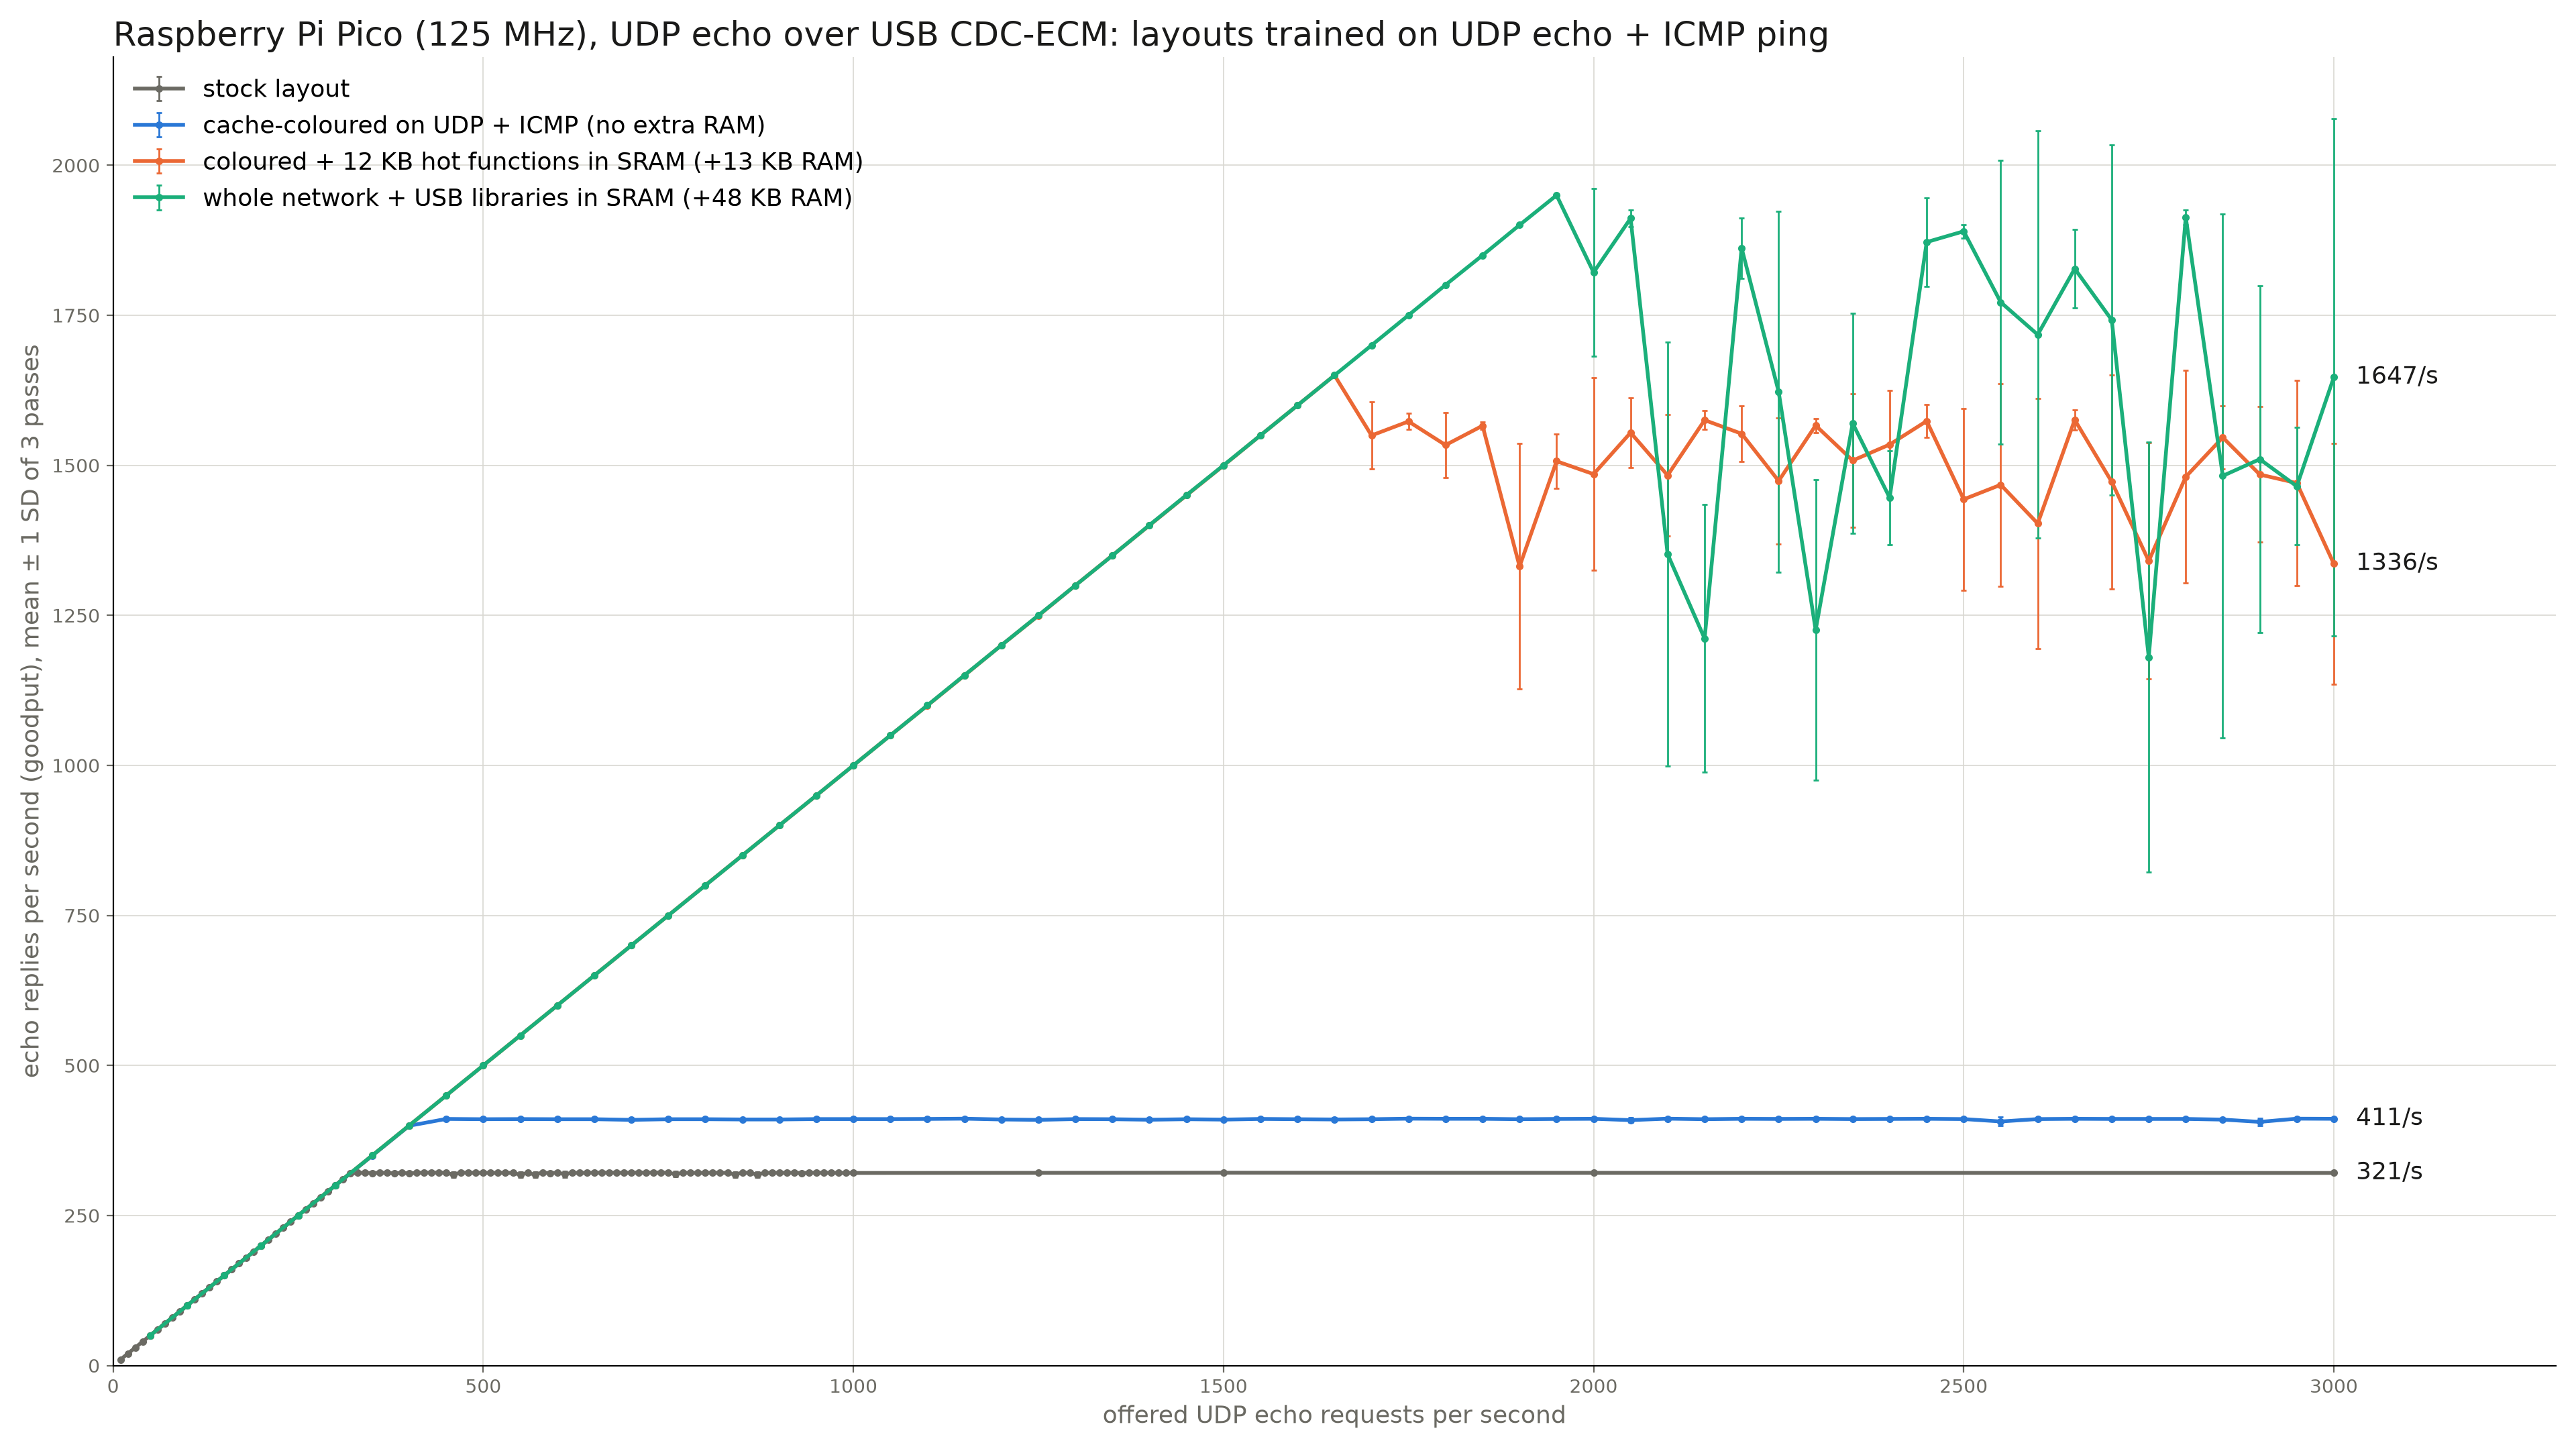
| UDP echo rate | Host sends UDP datagrams at fixed rates (50/s steps up to 3000/s); replies counted per step; 3 passes, each with a new flash of the image. The peak is the highest rate of replies. |
| Footprint | Flush the cache over SWD, send one echo, count the misses, minus an idle window: the number of distinct 8-byte lines that one echo touches. |
Repeated runs of the same image agree within 1–2 % for misses and within 0.005 ms for most turnaround values.
Finding the hot code
The Cortex-M0+ in the RP2040 has the DWT program-counter sample register. The debug probe reads it about 4,000 times per second while the board works, without stopping it. In the stock image almost every line that executes misses the cache on every echo, so the samples show where the misses are. Per library, 22 % of the busy time is in the IP stack, 20 % in the kernel, 7 % in the USB device driver, 5 % in the USB device stack, and smaller parts in Ethernet L2, net_buf and libc.
About 230 functions (20–25 KB) receive samples during a ping load. The cold-cache probe gives the true size of what one echo touches:
| Echo | Lines | Bytes |
|---|---|---|
| ICMP ping, 56 B | 3,506 | 27 KB |
| UDP echo through a socket, 64 B | 5,031 | 39 KB |
| Cache capacity | 2,048 | 16 KB |
This is the central fact. A cyclic pass over 3,500 lines through a 2,048-line cache must miss about 1,000 times per pass, even with ideal replacement. Layout can remove conflict misses, not capacity misses.
Layouts without extra RAM
A linker snippet placed in the first output section of the image (after the vector table) lists the hot functions; GNU ld gives each input section to the first rule that matches, so these functions leave the general text section. Three arrangements were tested:
- Hot block: the sampled functions in one contiguous block.
- Cache colouring: each function receives a start set so that few sets hold more than two often-executed lines (LRU with three lines in two ways misses on every access). Padding between functions makes this possible; the image grows from 92 KB to about 120 KB of the 2 MB flash.
- Link-time optimization (LTO), alone and combined with colouring.
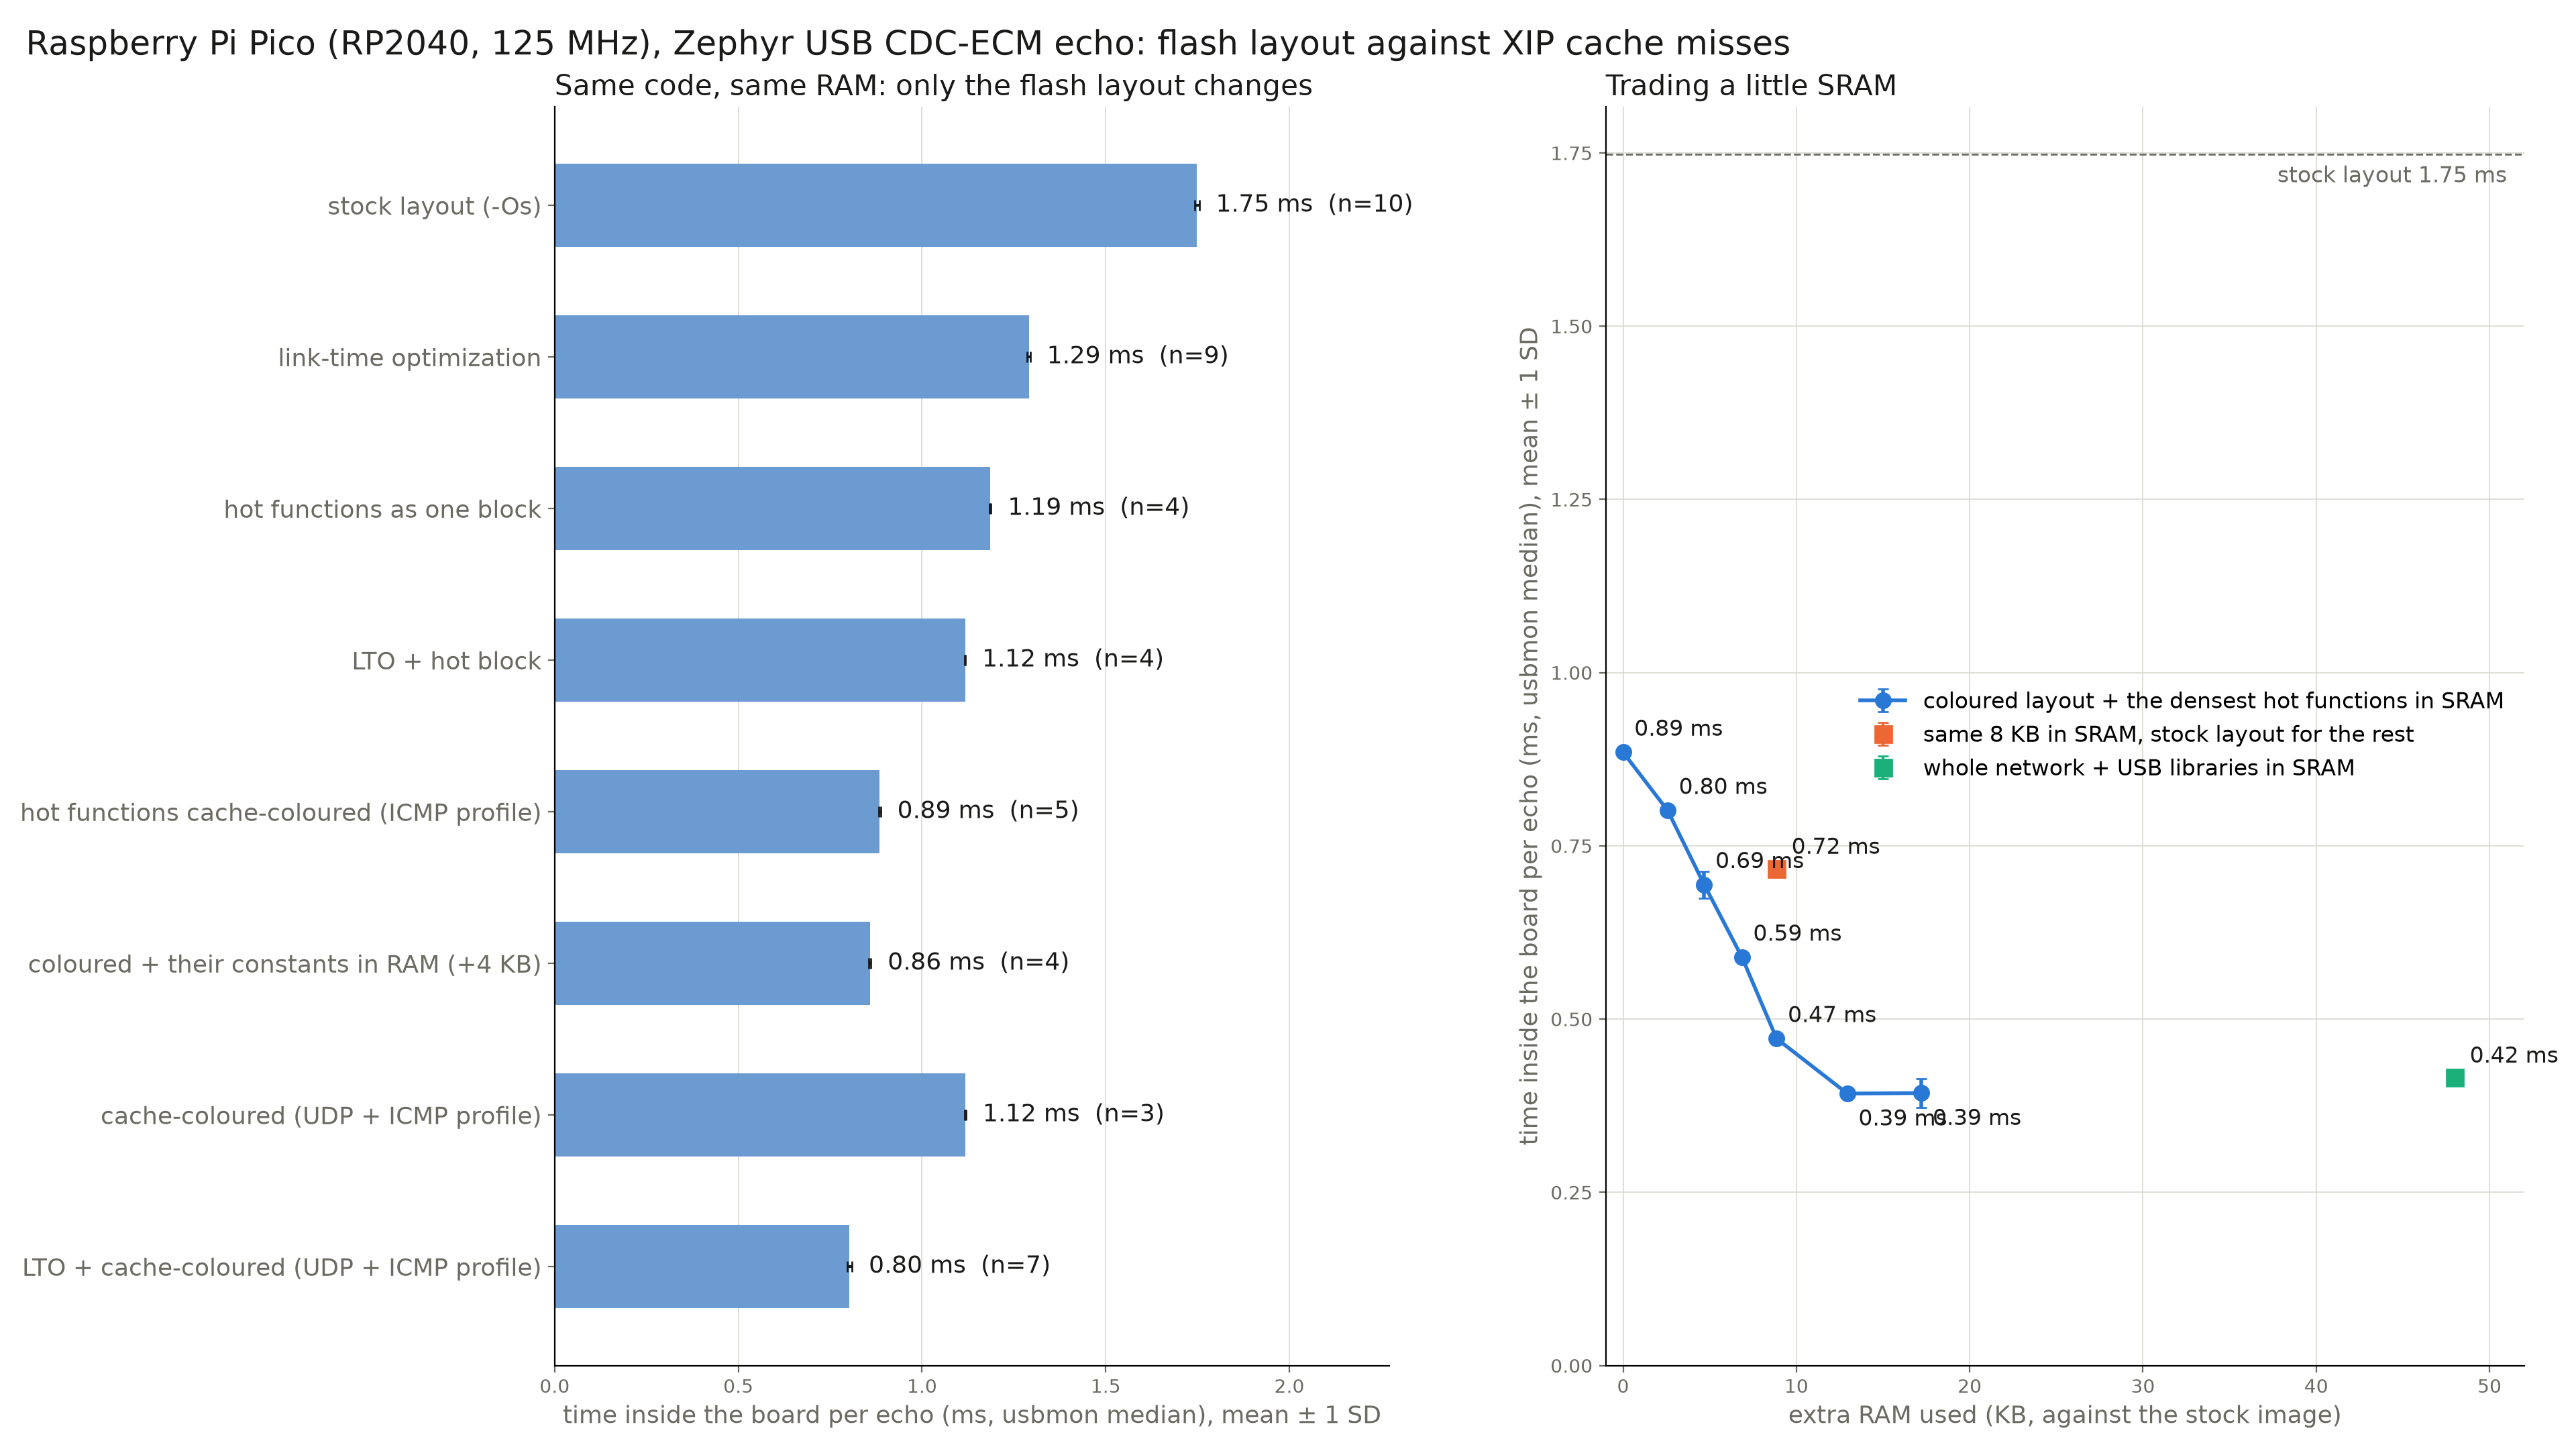
| Layout | Misses per echo | Turnaround |
|---|---|---|
| Stock | 2,277 | 1.747 ms |
| LTO | 1,666 | 1.291 ms |
| Hot block | 1,424 | 1.186 ms |
| Cache colouring (ping profile) | 940 | 0.885 ms |
| LTO + colouring (UDP + ping profile) | 773 | 0.802 ms |
Adding a little SRAM
The colouring tool can also move the functions with the most samples per byte to SRAM, either with Zephyr’s zephyr_code_relocate(… FILTER …) or through the .ramfunc section (a custom linker script places .ramfunc before the text section; this route also works with LTO). Busy-wait loops, which have many samples but few misses, are excluded. The rest of the hot code is coloured as before.
| Layout | Extra RAM | Peak UDP echo | Ping turnaround |
|---|---|---|---|
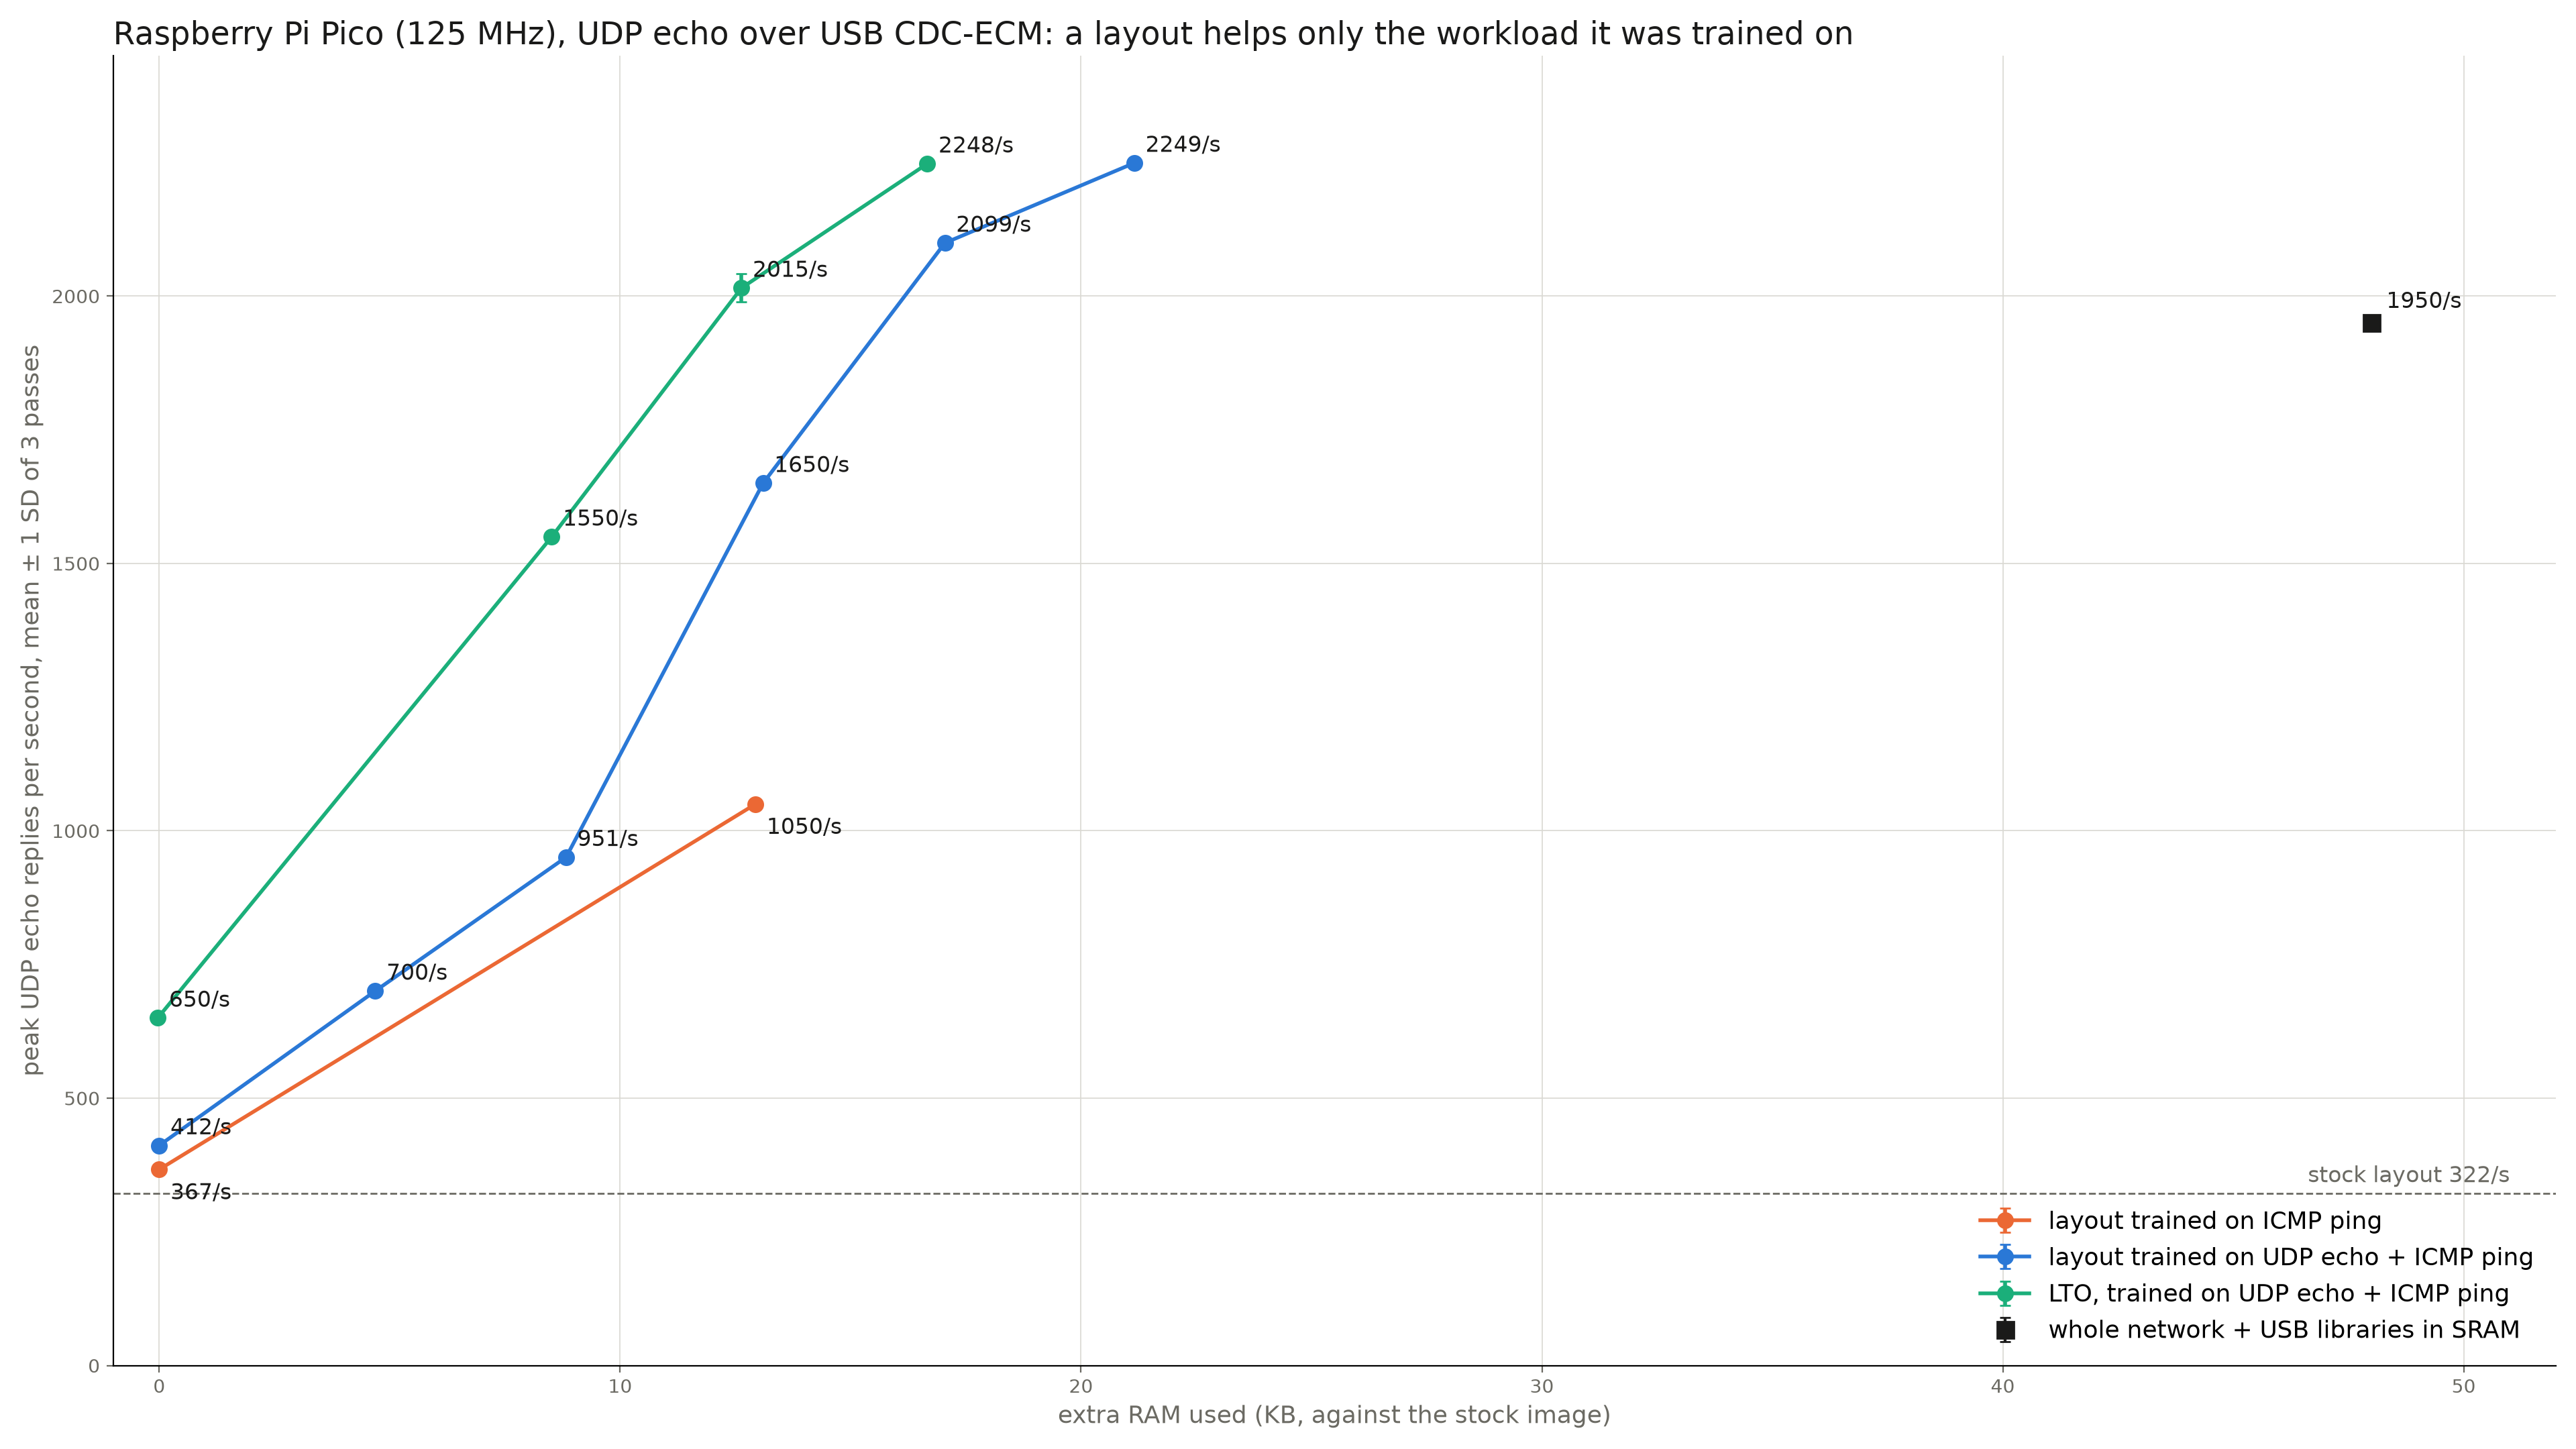
| Stock | 0 | 322/s | 1.747 ms |
| Coloured | 0 | 412/s | 1.118 ms |
| LTO + coloured | 0 | 650/s | 0.802 ms |
| Coloured + 4 / 8 / 12 KB in SRAM | 4.8 / 9.0 / 13.4 KB | 700 / 951 / 1,650/s | 0.946 / 0.536 / 0.458 ms |
| Coloured + 16 / 20 KB in SRAM | 17.5 / 21.7 KB | 2,099 / 2,249/s | 0.394 / 0.400 ms |
| LTO + coloured + 8 / 12 / 16 KB in SRAM | 8.5 / 12.6 / 16.7 KB | 1,550 / 2,015 / 2,248/s | 0.440 / 0.391 / 0.416 ms |
| Whole network + USB libraries in SRAM | 48 KB | 1,950/s | 0.416 ms |
| Teensy 4.1, 600 MHz, stock (for comparison) | – | 2,170/s | 0.193 ms |
Does it generalize?
| Check | Result |
|---|---|
| Ping-trained layout, UDP traffic | Small gain only: 322 → 367/s (with 12 KB in SRAM: 1,050/s instead of 1,650/s). Profile the workload that matters. |
| Larger packets (1,000 B ping, not in the profile) | Turnaround 3.31 → 1.93 ms: the same 1.38 ms saved per echo as at 56 B. |
| Name list only, no colouring | 16 KB list: 1,998/s with LTO, 1,700/s without (coloured: 2,248 and 2,099/s); 81–89 % of the gain. |
| Name list after a code change (network statistics enabled) | Stock 284/s → 1,750/s with the unchanged list from the other build. |
Colouring depends on exact function sizes and addresses, so it must be generated again for every build. A list of function names does not; it is the part that could become a reusable configuration.
What did not work
- Non-allocating cache alias. The RP2040 can run code through a mirror of the flash (0x11…) that reads the cache but never fills it. I placed the less dense hot code there so it would not evict the dense code. It was worse (with 8 KB resident: 4,609 misses instead of 940), because that code is reused within one echo and every reuse goes to the flash again.
- -O2. Bigger code, more misses: 3,404 per echo.
- Profile-guided optimization at -Os. GCC still optimizes for size and did not split hot and cold blocks; no measurable change. Collecting the profile also needed several fixes (Zephyr coverage builds use -O0 and change the inlining of
ALWAYS_INLINEfunctions). - Constant data in RAM. Moving the read-only data of the network and USB libraries to RAM (4 KB) saved only about 50 misses per echo; the misses are mostly code.
Limits and open points
- One board, one Zephyr revision, one echo application, one clock (125 MHz). An application adds its own code to the cache competition; profile with the application running.
- Above about 1,900 echoes per second, every fast image shows single rate steps where one of three passes collapses. The peaks are stable. Not analysed; the receive-overload path is the first suspect.
- The Teensy 4.1 also runs its code from external flash, through a 32 KB instruction cache. That the tuned Pico at 125 MHz is faster suggests that the Teensy is limited in the same way. Not yet tested.
Next
A natural upstream form is a list of hot function names for RP2040 networking, placed in SRAM by a Zephyr snippet or board option, with the measurements above as justification. Colouring stays an application-level tool. The PC-sampling profiler works over any SWD probe and needs no change to the firmware.
Evidence: all measurements on 1 November 2026 with the tools described above; mean of 3–9 independent runs per image.